The Part Summary tab displays a read-only summary of key material, geometry, and high-level production information:
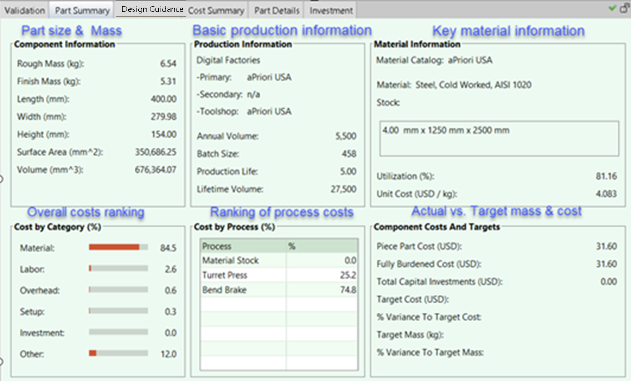
Use this tab to quickly target areas for cost reduction.
|
Area |
Description |
|---|---|
| Component Information |
Mass and part size summary information from the Component properties of the Geometric Cost Drivers panel and the Component Mass section of the Part Details tab. See Part Details and Assembly Details Tabs. |
| Production Information | Summary of values found on the Cost Guide (and replicated in the Cost Object window). Lifetime Volume is calculated by the Part Summary tab from the AnnualVolume and Production Life values. See Analyze Components with the Cost Guide. |
| Material Information |
Information taken from the Material Info section of the Part Details tab and the Material Selection window (available from the Manufacturing Process panel). A low Utilization (%) value can alert you to possible actionable issues. For example, a cast part is typically a "net" shape and should have a high utilization part. A high Unit Cost might indicate a design element that requires a premium material. Values that depart from expectations can indicate something to explore. Note: If you are working with a process group that uses stock material, such as Sheet Metal, Bar & Tube, the "Stock" field of the Material Information panel will be populated with relevant info from the Material Stock section of the Material Selection window. |
|
Cost by Category (%) |
A high-level view of where most of your costs come from. See Cost by Category (%). |
|
Cost by Processes (%) |
Which processes contribute the most to manufacturing cost. See Cost by Processes (%) |
|
Component Costs and Targets |
How the part stands regarding cost and mass goals (allow for some rounding differences). Targets are typically set in the Cost Guide. See Analyze Components with the Cost Guide. |
Cost by Category (%)
This shows a high-level view of where most of your costs come from.
aP Pro extracts various key values and calculates the percentage they represent of the Fully Burdened Cost for the part. Material, Labor, Overhead, Setup, and Investment all come from single values that can be viewed in the Part Details tab as shown below. Other is calculated by summing together multiple values: Logistics, Other Direct, Margin, Period Indirect Overhead, and SG&A. You can easily view the source for these percentages by holding your mouse over an entry to display a tool tip.
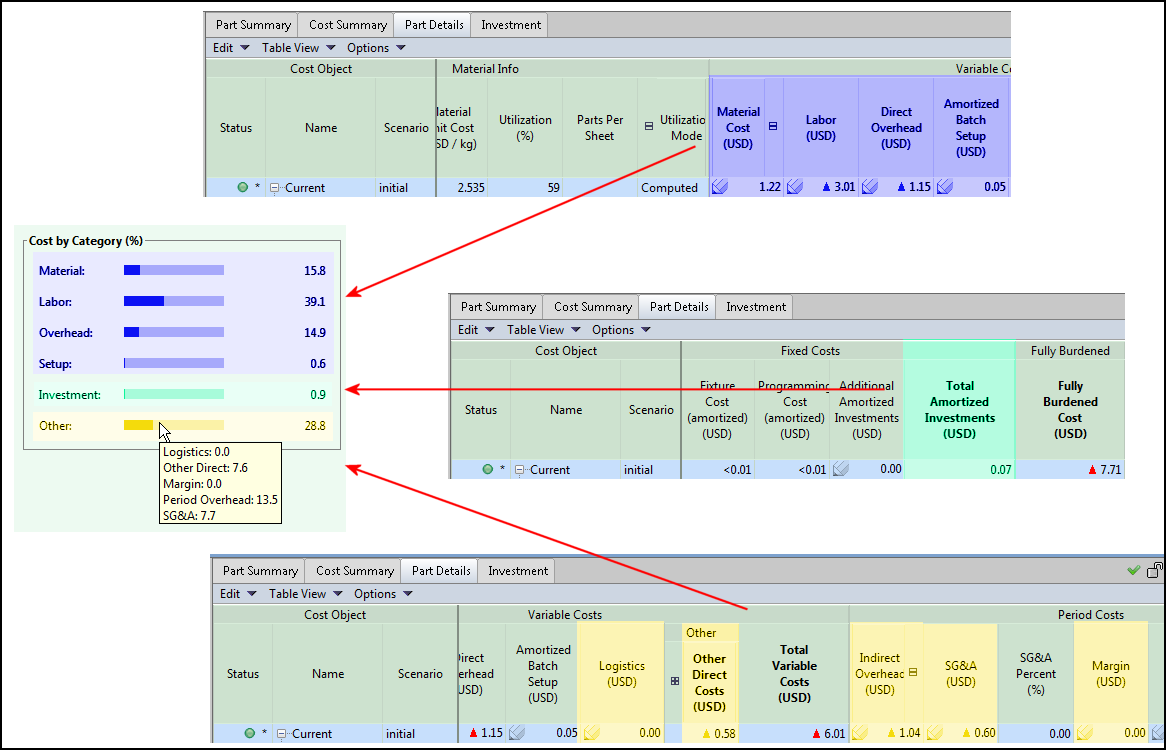
Note: Adding together the Labor, Overhead, and Setup percentages will tell you how much of the total cost is being spent on processes, the details of which can be viewed in the next panel (Cost by Process).
Cost by Processes (%)
This shows which processes contribute the most to manufacturing cost. Use this data to target high-cost processes for further investigation.
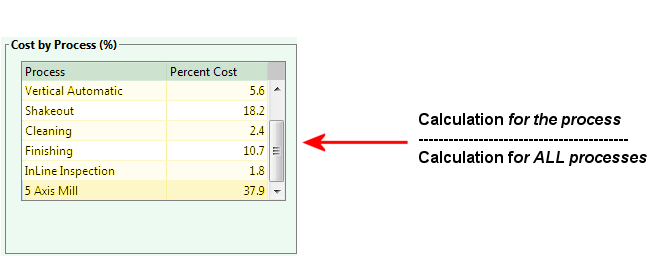
Tip: Click the Process column heading to sort the table alphabetically, or click the Percent Cost heading to sort the table numerically.
Calculation process
-
The percentage contribution of each process is calculated by comparing the sum of various process-related costs for that specific process, to the sum of these costs across all processes used in the routing.
-
This sum is used rather than basing the percentage on Piece Cost or Fully Burdened Cost (FBC), because for some processes the Material cost is included in Piece Cost and FBC and would result in a skewed comparison. So the Cost by Process calculations assume no contributions from Material, Material Overhead, SG&A, or Margin.
The calculation is:
Process:
(Labor Cost + Direct Overhead + Logistics + Amortized Batch Setup Costs +
(Other Direct Costs - Material Overhead) + Indirect Overhead Costs +
Fixed Costs) for the process
Divided by
Sum of (Labor Cost + Direct Overhead + Logistics + Amortized Batch Setup Costs +
(Other Direct Costs - Material Overhead) + Indirect Overhead Costs +
Fixed Costs) for processes